RF Spectrum Occupancy Analyser
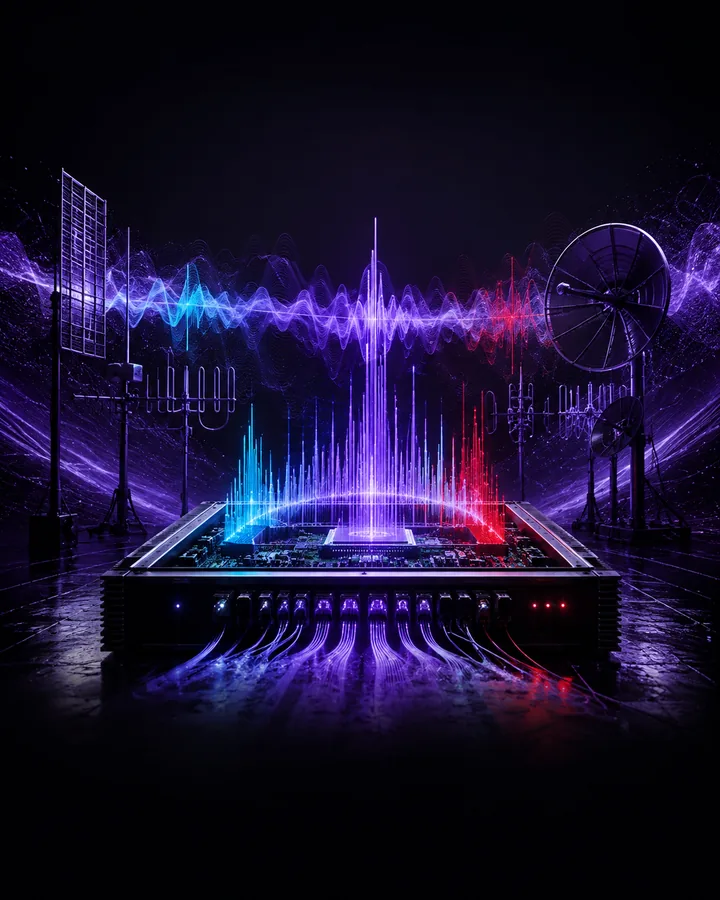
A completed receive-only RF engineering laboratory for measuring channel occupancy, occupied bandwidth, noise thresholds, events, and measurement uncertainty from complex baseband signals.
Project definition
Problem statement
Spectrum occupancy depends on both the observed signals and the measurement configuration. Noise drift, spectral leakage, threshold choice, frequency offset, and revisit time can change whether a channel appears occupied.
The engineering problem is to define occupancy precisely, calibrate a transparent receive-only detector, measure its performance against known truth, and retain the conditions under which it fails.
Project objectives
- Generate repeatable complex-baseband recordings for seven RF traffic and noise conditions.
- Calculate a Hann-window spectrogram and integrate power over eight declared channels.
- Estimate an independent noise reference and apply a configurable relative threshold.
- Measure channel-frequency occupancy, frequency-bin occupancy, resource occupancy, and events.
- Quantify sensitivity to threshold, FFT resolution, window, revisit time, noise drift, frequency offset, and observation duration.
- Report detector recall, specificity, balanced accuracy, occupancy error, and uncertainty.
Project structure
Project components
Signal model
Generates reproducible noise, steady carriers, bursts, adjacent signals, low-SNR signals, and frequency-agile traffic.
Spectral processor
Segments complex samples, applies the selected window, and calculates time-frequency power.
Occupancy detector
Calibrates channel thresholds from independent noise and produces bin, channel, resource, and event decisions.
Experiment runner
Runs the baseline cases and seven controlled sensitivity studies plus paired Monte Carlo trials.
Evidence package
Exports CSV, JSON, NPZ, SigMF, figures, tests, references, and editable documentation.
Methodology
Project workflow
- 01Configure
Read the retained sample rate, channel plan, FFT, overlap, threshold, seed, and observation duration.
- 02Generate
Create a labelled complex-baseband recording for the selected traffic scenario.
- 03Calibrate
Use an independent noise-only recording to determine the channel detection thresholds.
- 04Analyse
Calculate the spectrogram, channel power, decisions, events, occupancy definitions, and confidence intervals.
- 05Compare
Inspect baseline accuracy and the retained threshold, revisit, drift, offset, resolution, and duration limits.
Demonstration scenario
Run the mixed-traffic recording, inspect the eight-channel waterfall, compare known and detected activity, and calculate three occupancy definitions. Then increase revisit time, noise drift, and frequency offset to show where a detector that performs well at baseline begins to lose events or assign occupancy to the wrong channel.
Engineering
Tools and method
- Tools
- The project uses Python, NumPy, SciPy, Pandas, Matplotlib, SigMF, Jupyter for subject analysis, simulation, and results.
- Signal generation
- Python and NumPy create complex thermal noise and scheduled channel signals at a 256 ksample per second baseband rate.
- Spectral analysis
- SciPy and NumPy implement the Hann-window spectrogram and channel-power integration.
- Statistics
- SciPy calculates exact binomial confidence intervals, while Pandas retains every experiment row.
- Figures
- Matplotlib creates fourteen labelled measurement, sensitivity, uncertainty, and performance figures.
- Verification
- Forty-one tests, branch coverage, dependency checks, a vulnerability audit, and release validation support the delivered result.
Testing
Evaluation
Evaluation measures
- Signal recall and noise-only specificity across the seven baseline scenarios
- Balanced accuracy and spectral resource occupancy error
- Event recall as the effective revisit interval increases
- False occupancy under positive noise-floor drift
- Channel assignment error under common frequency offset
- Confidence-interval width as observation duration changes
- Distribution of accuracy across 120 paired Monte Carlo trials
Project boundaries
- The retained evidence is synthetic and does not claim real occupancy at the nominal 915 MHz metadata frequency.
- The project is receive-only and contains no transmitter, protocol decoder, or interference function.
- The amplitudes are numerical dBFS-related values and are not calibrated dBm or field-strength measurements.
- One receiver, antenna, time, and location cannot represent a wider geographic area.
- Any hardware extension requires legal and institutional permission, receiver calibration, documented equipment, and review of the relevant spectrum rules.
Included
- 01Eight-channel synthetic complex-baseband RF laboratory
- 02Seven baseline traffic, noise, interference, and frequency-agile scenarios
- 03Independent noise calibration and threshold-based occupancy detector
- 04Channel occupancy, bin occupancy, spectral resource occupancy, events, and confidence intervals
- 05Threshold, resolution, window, revisit, noise-drift, frequency-offset, and duration studies
- 06A 120-run paired Monte Carlo experiment and 723 retained result records
- 07Representative SigMF recording and fourteen labelled project figures
- 08Forty-one automated tests with 100 percent core coverage
- 09Complete project files, calculations, results, and analysis material in a private GitHub repository
- 10A 70-page project report in PDF and editable Word formats
- 11A 15-page setup and usage guide in PDF and editable Word formats
- 12Fifty annotated references with licensed literature-image provenance
Project record
No information is collected on this page.
- Permanent project ID
- GP-EC-1EJIRBX
- Catalogued
- 21 Aug 2026
- Completed
- 26 Aug 2026
- Verified
- 26 Aug 2026
- Demonstration
- Included in repository
Handover
After purchase
- 01Payment is confirmed
The project is marked unavailable and cannot be purchased again.
- 02Repository access is granted
The buyer's submitted GitHub account receives access to the private repository.
- 03The purchase record is delivered
The certification sheet is prepared from the reviewed buyer details and sent privately by email.