Power-Quality Harmonic and Voltage-Event Analyser
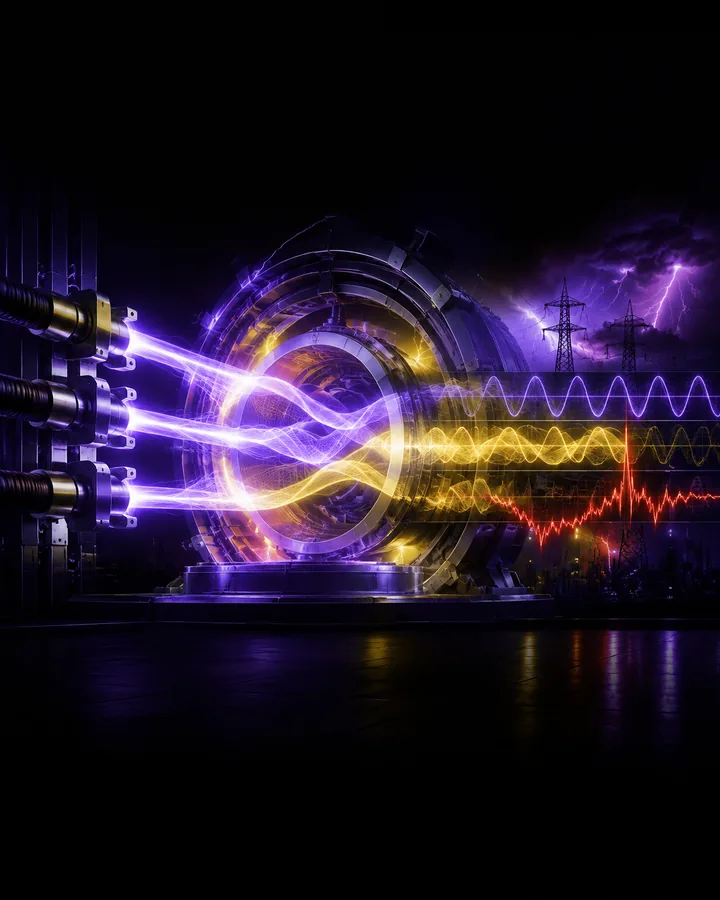
An offline electrical power-quality study that measures frequency, harmonics, distortion, power quantities, voltage events, and three-phase unbalance from sampled waveforms.
Project definition
Problem statement
Nonlinear loads and supply disturbances distort voltage and current waveforms. Frequency drift, sampling choices, noise, sensor scaling, and window alignment can also change the calculated result.
The engineering problem is to implement traceable offline measurements for harmonics, power, voltage events, and three-phase unbalance, then verify those measurements against signals with known analytical values.
Project objectives
- Generate and analyse repeatable single-phase and three-phase voltage and current waveforms.
- Estimate fundamental frequency, RMS, phase, active power, reactive power, apparent power, and power factor.
- Measure harmonic magnitudes through order 50 and calculate voltage and current total harmonic distortion.
- Detect prepared sag, swell, and interruption events from sliding RMS measurements.
- Measure voltage unbalance using positive- and negative-sequence components.
- Quantify sensitivity to noise and measurement uncertainty through seeded repeated trials.
Project structure
Project components
Waveform generator
Creates six documented scenarios with known frequency, harmonic, event, phase, noise, and unbalance conditions.
Signal processor
Validates sampled channels and estimates the fundamental frequency before measurement.
Harmonic analyser
Uses joint least-squares fitting to measure harmonic magnitude and phase through order 50.
Power calculator
Calculates RMS, active, reactive, and apparent power together with true and displacement power factor.
Event and unbalance analyser
Detects voltage events from sliding RMS and calculates symmetrical components and voltage-unbalance factor.
Experiment runner
Runs every scenario, analytical check, uncertainty trial, and figure export through repeatable commands.
Methodology
Project workflow
- 01Generate a scenario
Select one of the six prepared cases and create the sampled voltage and current channels.
- 02Validate the signals
Check channel length, finite values, sample rate, scaling, and usable frequency range.
- 03Measure the waveform
Estimate frequency and calculate RMS, power, harmonic, distortion, event, and unbalance quantities.
- 04Export the evidence
Save the numerical results, harmonic tables, event intervals, and labelled figures.
- 05Verify the result
Compare measured quantities with analytical references and run seeded uncertainty trials.
Demonstration scenario
A three-phase supply contains voltage and current harmonics, a 49.82 Hz fundamental, and known phase relationships. The analyser estimates frequency, measures individual harmonics and THD, calculates power quantities, and compares every retained value with its analytical reference. Separate scenarios demonstrate voltage events and unbalance.
Engineering
Tools and method
- Tools
- The project uses Python, NumPy, Pandas, SciPy, Matplotlib, Jupyter for subject analysis, simulation, and results.
- Numerical calculations
- Python and NumPy for waveform generation, least-squares harmonic fitting, power quantities, and sequence components.
- Signal routines
- SciPy for signal-processing support and repeatable numerical analysis.
- Result tables
- Pandas for scenario summaries, harmonic tables, events, uncertainty results, and exports.
- Figures
- Matplotlib for waveforms, spectra, event timelines, phasors, error plots, and comparison figures.
- Verification
- Analytical references, deterministic seeds, 86 automated tests, branch coverage, Linux checks, and a dependency audit.
Testing
Evaluation
Evaluation measures
- Estimated fundamental frequency of 49.820074 Hz for a 49.82 Hz reference
- Voltage THD of 4.582791 percent against a 4.582576 percent reference
- Current THD of 23.854088 percent against a 23.853721 percent reference
- Precision, recall, and F1 score of 1.0 on the prepared voltage events
- Mean event-start error of 0.00333 seconds and mean duration error of 0.01 seconds
- Voltage-unbalance factor of 3.01926 percent in the prepared unbalance scenario
- Thirteen of thirteen analytical checks passing across six scenarios
- Uncertainty distributions from 180 seeded measurement trials
Project boundaries
- The project analyses offline generated or properly prepared sampled data and does not connect to mains electricity.
- It is not a certified power-quality instrument and does not replace calibrated measurement equipment.
- Event thresholds and study limits are declared analysis settings, not universal compliance limits.
- Results from external recordings depend on correct sensor calibration, scaling, timing, and channel mapping.
Included
- 01Offline waveform generation and power-quality analysis software
- 02Six prepared electrical scenarios with CSV and JSON results
- 03Frequency, harmonic, THD, RMS, power, power-factor, event, and unbalance calculations
- 04Twenty-six labelled analytical figures
- 05Thirteen analytical verification checks and a 180-run uncertainty study
- 0686 automated tests with 97.50 percent branch coverage
- 07Complete project files, calculations, results, and analysis material in a private GitHub repository
- 0890-page project documentation in PDF and editable Word formats
- 0911-page setup and usage guide in PDF and editable Word formats
- 1057 annotated references
Project record
No information is collected on this page.
- Permanent project ID
- GP-EE-1CKO99D
- Catalogued
- 21 Aug 2026
- Completed
- 27 Aug 2026
- Verified
- 27 Aug 2026
- Demonstration
- Included in repository
Handover
After purchase
- 01Payment is confirmed
The project is marked unavailable and cannot be purchased again.
- 02Repository access is granted
The buyer's submitted GitHub account receives access to the private repository.
- 03The purchase record is delivered
The certification sheet is prepared from the reviewed buyer details and sent privately by email.